
You’re making an update to a product page on your website. First, you want to check page view statistics for the page. So you open another browser tab and login to your web analytics system. You enter the date range, look for the right menu, then copy/paste the page URL.
Ah, 1,954 page views. OK. You should make sure the change will work for mobile viewers, so you try to remember where you saw the report on viewers by device. Oh, there it is.
What if you could get the same answer
while you are editing the product page?
Overview of Evoq’s Content Analytics
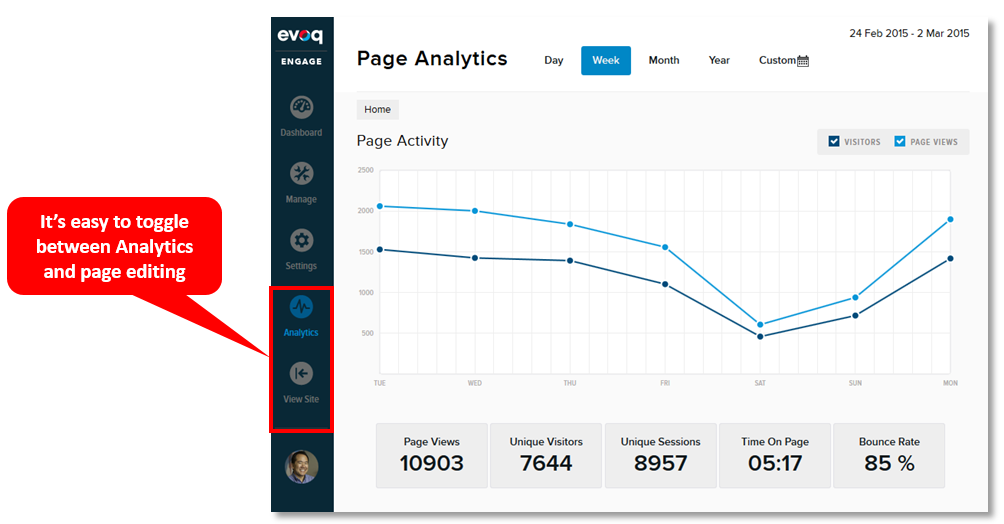
With Evoq, analytics can be viewed during the page editing process. It’s as easy as 1-2-3:
- Navigate to the product page
- Click on “Analytics”
- Find the page view figure, then click “View Site” to return to the page
It really is that easy. Our analytics is based on data collected and managed by Evoq.
Any marketer, regardless of their level of proficiency with analytics, can immediately understand how content is performing, without navigating to a separate web analytics system.
Benefits of Evoq’s Content Analytics
1) Instant access to real-time data
It can be a hassle to keep toggling between your web CMS and your web analytics system. Evoq’s Content Analytics puts web analytics right at your fingertips. Visit a page, click “Analytics” and voila! You’re there. And yes, all of the data in Content Analytics is provided in real-time.
2) A snapshot of essential metrics
Some analytics reports give you everything but the kitchen sink, showing numerous variables and metrics that may not concern you. Let me tell you, a kitchen sink full of dirty dishes is not a pleasant site.
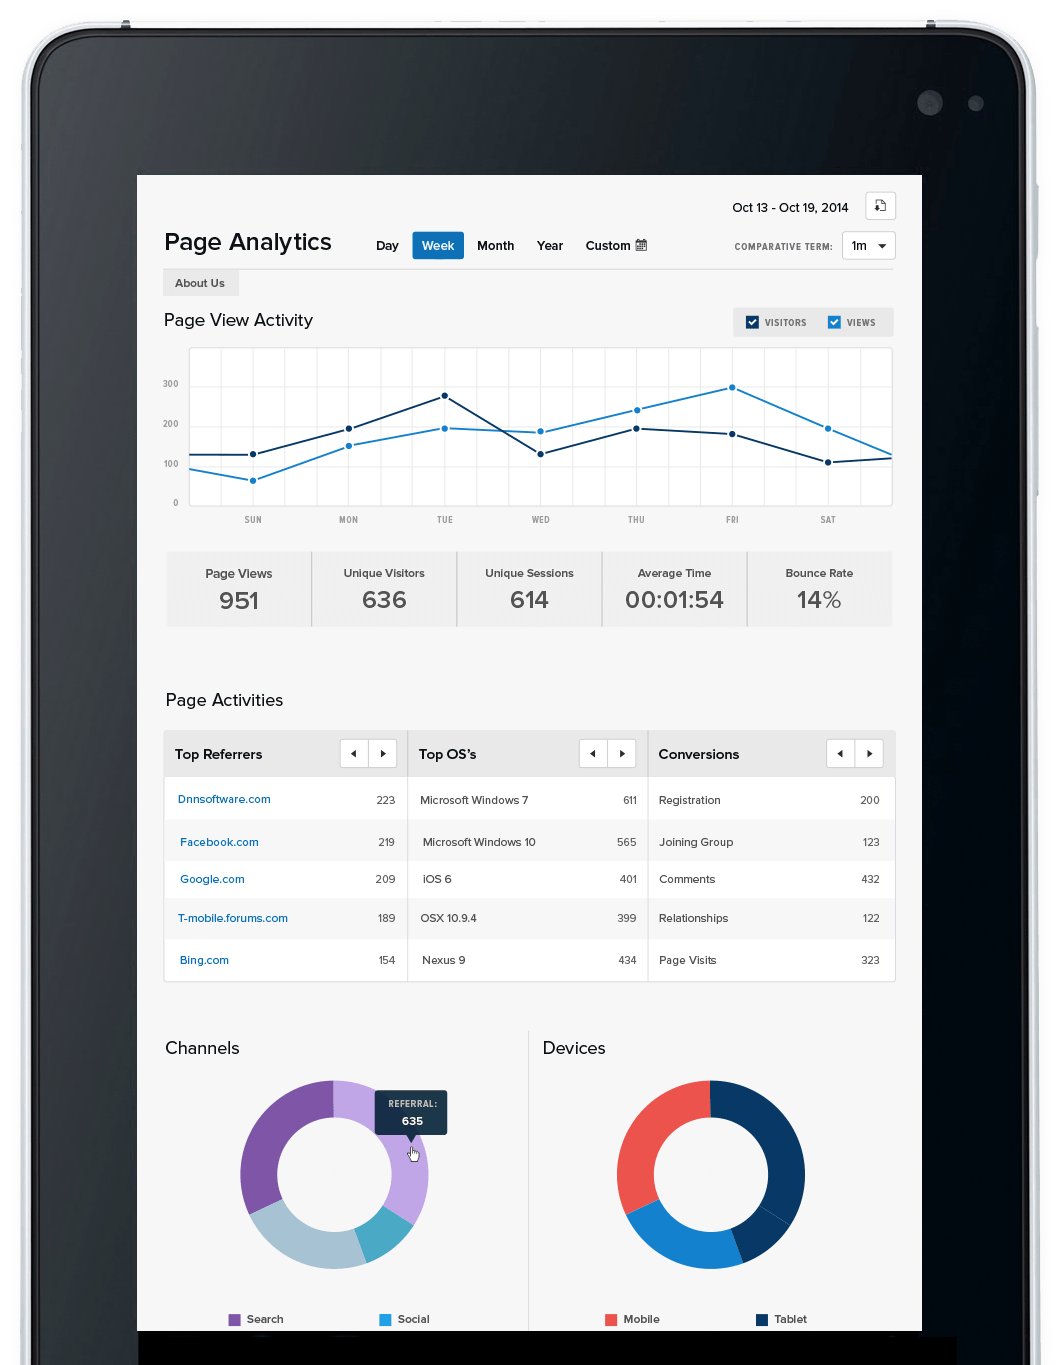
Our Content Analytics give you essential metrics that web marketers care about:
Page views, unique visitors, sessions, time on page, bounce rate, top referrers, top operating systems and conversions.
In addition, you can easily toggle among day, week, month and year, as well as custom date ranges. Our “Navigation Summary” gives you a visual representation of top referring pages (left side), as well as top exit pages (right side).
3) Embark on Data-Driven Website Journeys
I recently took a journey through the DNN website. Here are the main sections I visited:
-
Home page
- Products
- Solutions
- Resources -> Data Sheets
- Resources -> Case Studies
- Services -> DNN Partners
At a number of stops, I visited a number of secondary pages contained in that section. At each page, I clicked on “Analytics.” I wanted a quick snapshot of: page views, top referrers and top exit pages. I also glanced at the trend chart for “Time on Page.”
I got a meaningful health check of our entire site in minutes.
Web analytics systems are great, but it’s impossible to take a similar journey through them. I need to tell the analytics system which page I want data on. So I copy/paste that URL and it tells me. I’m
not able browse through my site and get this data in context.
With Evoq, I plan to take such journeys on a regular basis.
Improve the Effectiveness of Your Website
Let’s look at use-cases of Evoq’s Content Analytics that can improve your website’s effectiveness.
1) Personalize pages based on device type
We have a page on our site that provides
different types of resources: data sheets, white papers, videos, etc. Let’s say that Evoq’s Content Analytics show that 60% of visitors are coming from mobile devices. How could we make the Resources page more effective for mobile visitors?
We could take advantage of Evoq’s
content personalization capability to create a personalized page for mobile users. The personalized page could emphasize resources that are more likely to be viewed on a mobile device, such as videos.
Longer form content, such as product manuals and data sheets, are less likely to be viewed on a mobile device. So those resources could be moved lower on the page, or hidden altogether. To see if our change had any effect, we’d look to Evoq’s Content Analytics.
To validate our theory that mobile visitors would view videos, we’d visit the “Videos” page, click “Analytics,” then see how many referrals came from the “Resources” page that we personalized for mobile visitors.
2) Optimize on-page content for your webinars
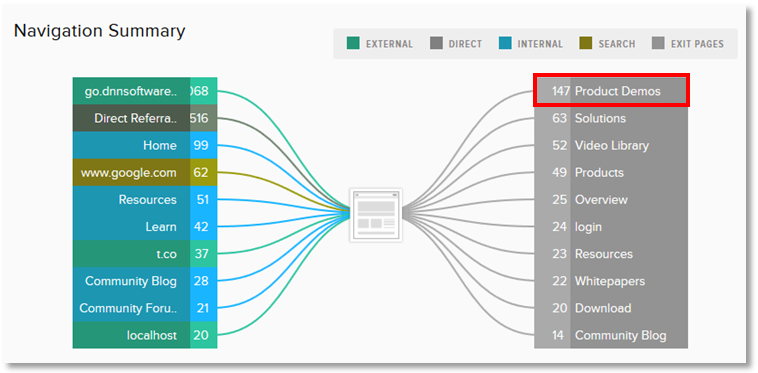
We list all of our upcoming and on-demand webinars on
our Webinars page. Webinars are one of our top sources of leads. This page sees a lot of traffic, both from existing visitors and from our webinar promotional programs.
As the Navigation Summary shows, the top exit page (from our Webinars page) is our
Product Demos page. On this page, we provide a number of on-demand videos: a few product videos and some on-demand webinars.
While it’s great that visitors to our Webinars page want to go deeper on our site, some of these clicks could result in a lost conversion for a webinar sign-up. So one thing do is embed a product demo video directly on the Webinars page. We might sacrifice additional page views for more time on page and increased webinar registrations.
3) Optimize page content based on traffic source
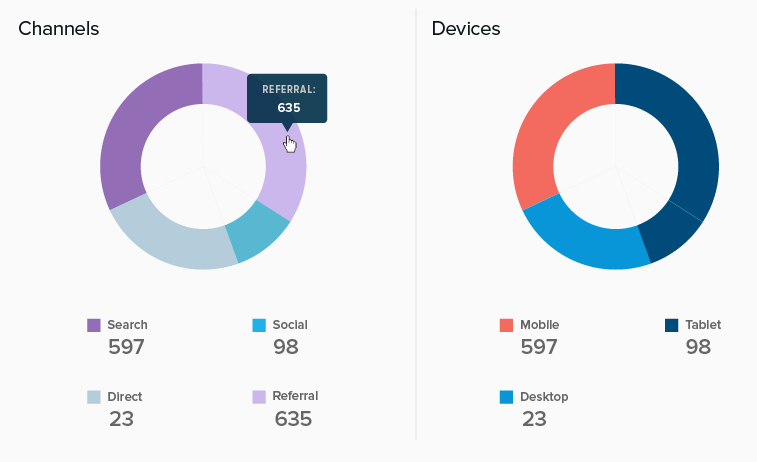
In the "Channels" pie chart of Evoq's Content Analytics, we break out traffic by these categories:
- Search
- Direct
- Social
- Referral
Imagine that a product page receives 70% of traffic from search. Visitors arriving at this page from a search engine are actively researching. They typed a phrase into a search engine, saw your page in the search engine results page and clicked on it.
Try providing calls-to-action that move visitors along the sales cycle. Invite them to download the data sheet, start a free trial, view a video or request a demo. Visitors to this page are actively researching. So make sure you provide answers to their questions
You can’t just set it and forget it, however. If the percentage of search traffic drops (e.g. from 70% one month to 40% the next month), you’ll need to re-assess and adjust your page content accordingly.
4) Generate more leads TO your white papers
B2B companies use white papers to generate leads. Visitors discover a white paper that interests them and fill out a registration form to download the paper. During my data-driven website journey I visited the
White Papers page on our site. Here’s what I saw:
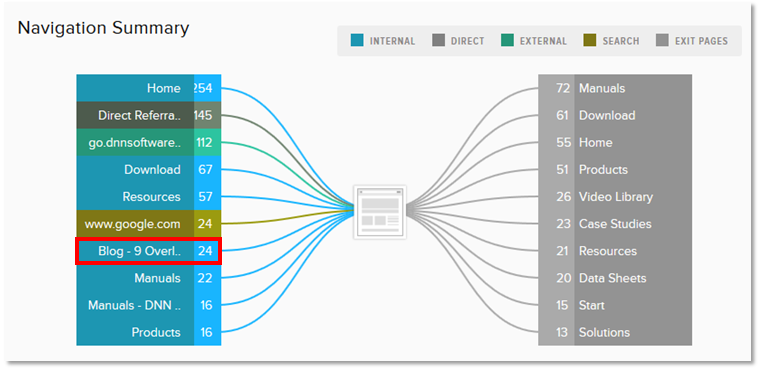
24 page views of our White Papers page came from a blog post. If you
read that particular post, you’ll see that a call-to-action is provided at the bottom, pointing to one of our white papers. Neat! Given this result, my plan is to do this more often: when publishing blog posts, insert a call-to-action to a related white paper.
Next Steps
Hopefully, I’ve shown you a few ways you can make use of Evoq’s Content Analytics to increase the effectiveness of your website. Since I touched on a number of different areas, I thought I’d leave you with a few resources that provide further info:
- Web page: Evoq’s Content Analytics
- Web page: Evoq’s Content Personalization
- Feature sheet: Evoq's Content Personalization (PDF)